


Starting a career in data analytics requires a strong understanding of data handling, SQL, spreadsheets, statistics, and visualization. During technical interviews, candidates may also encounter questions connected with React components, and asp net core especially when the position involves working closely with software development and engineering teams. Preparing for a data analyst interview requires more than memorizing definitions; candidates should understand how to analyze information and communicate meaningful insights.
Freshers preparing for technical roles may come across Python coding problems, and Java Backend Developer concepts when applying to organizations where analytics teams collaborate with developers. However, the primary focus of a data analyst interview remains SQL, Excel, data visualization, statistics, data cleaning, reporting, and problem-solving. This guide covers important questions and answers to help candidates prepare systematically.
What Does a Data Analyst Do?
A data analyst collects, cleans, transforms, analyzes, and interprets data to support business decisions. Analysts commonly work with databases, spreadsheets, dashboards, reporting platforms, and visualization tools.
Their responsibilities may include:
- Collecting data from different sources
- Cleaning inaccurate or duplicate records
- Writing SQL queries
- Creating Excel reports
- Building dashboards
- Identifying trends and patterns
- Preparing business reports
- Communicating insights to stakeholders
- Supporting data-driven decision-making
1. What Is Data Analysis?
Answer:
Data analysis is the process of collecting, cleaning, transforming, and examining data to identify useful patterns, trends, relationships, and insights. Businesses use data analysis to make informed decisions, identify problems, measure performance, and forecast future outcomes.
For example, an e-commerce company can analyze sales data to identify its best-selling products and determine which products generate the highest revenue.
2. What Are the Different Types of Data Analysis?
Answer:
The major types of data analysis include:
| Type | Purpose | Example |
| Descriptive Analysis | Understand what happened | Monthly sales report |
| Diagnostic Analysis | Understand why it happened | Finding reasons for sales decline |
| Predictive Analysis | Estimate what may happen | Forecasting future sales |
| Prescriptive Analysis | Recommend actions | Suggesting pricing strategies |
A good analyst should understand how each type supports business decisions.
3. What Is a Data Analysis Interview?
A data analysis interview evaluates a candidate’s ability to work with data and solve practical business problems. Interviewers may test SQL, Excel, statistics, visualization, logical reasoning, and communication skills.
Freshers should prepare both theoretical questions and practical scenarios because companies often want to understand how candidates approach an unfamiliar dataset.
4. What Is SQL and Why Is It Important for Data Analysts?
Answer:
SQL, or Structured Query Language, is used to communicate with relational databases. Data analysts use SQL to retrieve, filter, aggregate, update, and analyze data stored in databases.
Common SQL operations include:
- SELECT
- WHERE
- GROUP BY
- ORDER BY
- HAVING
- JOIN
- Aggregate functions
- Subqueries
- Common Table Expressions
5. What Are SQL Joins?
Answer:
SQL joins combine records from two or more tables using a related column.
The most common joins are:
| Join | Description | Typical Use |
| INNER JOIN | Returns matching records | Customers with orders |
| LEFT JOIN | Returns all records from left table | All customers and their orders |
| RIGHT JOIN | Returns all records from right table | All orders and matching customers |
| FULL OUTER JOIN | Returns matching and non-matching records | Comparing two datasets |
For example, a customer table and an orders table can be joined using a customer ID.
6. What Questions Are Common in a SQL Interview for Data Analysts?
A SQL interview for data analysts may include both theoretical and practical questions. Candidates can be asked to write queries involving filtering, aggregation, joins, subqueries, and ranking.
Examples include:
- Find duplicate records.
- Find the second-highest salary.
- Calculate total sales by month.
- Find customers who have never placed an order.
- Identify the highest-selling product.
- Calculate average revenue by category.
Freshers should practice writing queries rather than only reading SQL concepts.
7. What Is Excel Used for in Data Analysis?
Answer:
Excel is widely used for data cleaning, calculations, reporting, analysis, and visualization. Analysts can work with large datasets using formulas, pivot tables, charts, filters, and conditional formatting.
Important Excel interview questions may focus on:
- VLOOKUP and VLOOKUP
- INDEX and MATCH
- IF statements
- SUMIF and COUNTIF
- Pivot tables
- Conditional formatting
- Data validation
- Removing duplicates
- Sorting and filtering
8. What Is a Pivot Table?
Answer:
A Pivot Table is an Excel feature used to summarize and analyze large amounts of data quickly. It allows users to group information and calculate values such as sums, averages, and counts.
For example, a sales dataset can be summarized by:
- Product
- Region
- Salesperson
- Month
- Revenue
Pivot Tables are especially useful when preparing management reports.
9. What Are Data Visualization Questions?
Answer:
Data visualization questions assess whether a candidate knows how to represent information clearly using charts, graphs, and dashboards.
Interviewers may ask:
- Which chart would you use to show monthly sales?
- When should you use a bar chart?
- What is the purpose of a line chart?
- How would you visualize geographical data?
- How can you avoid misleading visualizations?
The right visualization depends on the type of data and the business question.
10. Which Chart Should You Use for Different Types of Data?
| Business Requirement | Recommended Chart | Reason |
| Monthly trend | Line Chart | Shows changes over time |
| Category comparison | Bar Chart | Easy comparison |
| Percentage distribution | Pie/Donut Chart | Shows simple proportions |
| Relationship between variables | Scatter Plot | Shows correlation |
| Geographical comparison | Map | Displays location-based patterns |
An analyst should avoid unnecessarily complicated charts because they can make the information difficult to understand.
11. What Are Analytical Skills Questions?
Analytical skills questions are designed to understand how candidates approach problems logically.
For example, an interviewer might ask:
“A company’s sales decreased by 20% this month. How would you investigate the reason?”
A strong answer would involve checking:
- Sales by product.
- Sales by region.
- Customer activity.
- Pricing changes.
- Marketing campaigns.
- Inventory availability.
- Previous month’s performance.
- External factors.
The goal is to demonstrate a structured problem-solving approach rather than immediately assuming one cause.
12. How Do You Clean a Dataset?
Answer:
Data cleaning involves identifying and correcting inaccurate, incomplete, inconsistent, or duplicate information.
A typical process includes:
- Removing duplicate records
- Handling missing values
- Correcting inconsistent formats
- Checking invalid values
- Standardizing text
- Identifying outliers
- Validating data types
- Checking relationships between fields
Data cleaning is important because poor-quality input can produce misleading analytical results.
13. What Is the Difference Between NULL and Zero?
Answer:
NULL generally represents missing or unknown information, while 0 is an actual numerical value.
For example:
- Sales = 0 means no sales were recorded.
- Sales = NULL may mean the sales information is unavailable.
Treating these values incorrectly can affect calculations and reports.
14. What Are DevOps Tools and Why Might a Data Analyst Encounter Them?
Although data analysts primarily work with analytical tools, they may collaborate with development and infrastructure teams that use DevOps tools.
Examples include:
- Git
- Docker
- Kubernetes
- Jenkins
- GitHub Actions
- Terraform
- Ansible
An analyst working in a technical organization may need basic awareness of these tools when handling automated reporting systems, data pipelines, or application environments.
15. What Are Git Commands a Technical Professional Should Know?
Basic Git commands can help analysts collaborate on SQL scripts, Python files, documentation, and analytics projects.
| Git Command | Purpose |
| git init | Creates a Git repository |
| git clone | Copies a repository |
| git status | Shows repository status |
| git add | Stages changes |
| git commit | Saves changes |
| git pull | Retrieves updates |
| git push | Uploads changes |
| git branch | Manages branches |
Freshers do not necessarily need advanced Git expertise for every analyst role, but understanding basic version control is useful.
16. What Are Kubernetes Pods?
Answer:
Kubernetes pods are the smallest deployable units in Kubernetes. A pod can contain one or more containers that share networking and storage resources.
For a data analyst, Kubernetes is generally a supporting technology rather than a core analytics skill. However, basic knowledge can be useful when analysts work with data applications deployed in cloud environments.
17. What Are Docker Containers?
Answer:
Docker containers package an application and its dependencies into a portable environment. This helps ensure that an application behaves consistently across different environments.
For example, a data processing application can be packaged inside a Docker container so that developers can run it consistently across development and production systems.
18. What Is AWS Cloud?
Answer:
AWS cloud provides a wide range of computing, storage, database, analytics, and infrastructure services.
A data analyst may encounter services such as:
- Amazon S3
- Amazon Redshift
- Amazon RDS
- Amazon Athena
- AWS Glue
- Amazon QuickSight
Knowledge of cloud platforms can be an advantage when analyzing data stored in cloud-based systems.
19. What Is an API?
Answer:
An API, or Application Programming Interface, allows different software applications to communicate with each other.
For example, a data analyst may retrieve information from an external service through an API and use that information for reporting or analysis.
API development is generally handled by software developers, but analysts may need to understand API requests, responses, authentication, JSON data, and basic API integration.
20. What Is the Difference Between Mean, Median, and Mode?
| Measure | Meaning | Example Use |
| Mean | Average value | Average sales |
| Median | Middle value | Typical salary |
| Mode | Most frequently occurring value | Most common category |
The median can be particularly useful when a dataset contains extreme values or outliers.
21. How Do You Handle Missing Data?
Answer:
The appropriate approach depends on why the data is missing and how important the field is.
Possible methods include:
- Removing records
- Replacing values with mean or median
- Using the most frequent value
- Forward or backward filling
- Assigning a specific category
- Keeping the missing value when it has analytical meaning
An analyst should understand the dataset before choosing a method.
22. How Would You Explain a Technical Finding to a Non-Technical Person?
Answer:
I would avoid unnecessary technical terminology and focus on the business impact.
For example, instead of saying:
“The conversion rate decreased by 15% due to a statistical variance in user acquisition.”
I could say:
“The number of visitors who completed a purchase decreased by 15%, mainly because fewer users from our main marketing channel completed their orders.”
Clear communication is an important part of a data analyst’s role.
23. What Is Correlation?
Answer:
Correlation measures the relationship between two variables.
For example, if advertising spending increases and sales also increase, there may be a positive correlation between the two variables.
However, correlation does not automatically mean that one variable causes the other. Additional analysis is required to establish causation.
24. How Would You Approach a New Data Analysis Project?
A structured approach can make the analysis more reliable:
- Understand the business problem.
- Identify the required data.
- Collect data from relevant sources.
- Clean and validate the dataset.
- Perform exploratory analysis.
- Identify patterns and trends.
- Create appropriate visualizations.
- Communicate findings.
- Recommend actions.
- Monitor results.
This process demonstrates both technical and analytical thinking.
25. What Makes a Good Data Analyst?
A good data analyst should combine technical knowledge with business understanding and communication skills.
Important qualities include:
- Strong analytical thinking
- SQL knowledge
- Excel skills
- Data visualization ability
- Attention to detail
- Problem-solving
- Statistical understanding
- Communication
- Curiosity
- Business awareness
Technical skills can help an analyst work with data, while communication skills help turn analysis into useful business decisions.
Quick Preparation Table for Freshers
| Skill Area | Topics to Prepare | Importance |
| SQL | Queries, joins, aggregation, subqueries | High |
| Excel | Formulas, Pivot Tables, lookups | High |
| Statistics | Mean, median, mode, correlation | High |
| Visualization | Charts, dashboards, storytelling | High |
| Data Cleaning | Missing values, duplicates, formatting | High |
| Python | Pandas, NumPy, basic analysis | Medium-High |
| Cloud | Basic AWS concepts | Medium |
| Version Control | Basic Git commands | Medium |
Scenario-Based Interview Questions
Scenario-based questions are common because they show how a candidate thinks when faced with real business problems.
Scenario 1: Sales Dropped Suddenly
If sales suddenly fall, first compare the current period with historical data. Then segment the information by product, location, customer type, marketing channel, and date to identify where the decline occurred.
Scenario 2: Dataset Contains Duplicates
First identify which columns should uniquely identify a record. Then locate duplicate rows and determine whether they are genuine duplicates or legitimate repeated transactions before removing anything.
Scenario 3: Dashboard Shows Different Numbers
Check the source dataset, filters, calculations, date ranges, joins, and refresh status. Differences can often occur because dashboards use different filters or data sources.
Scenario 4: Stakeholder Wants a Report Immediately
First clarify the business question and required metrics. Then prioritize the most important analysis and communicate any limitations rather than providing an inaccurate report simply to meet a deadline.

Conclusion
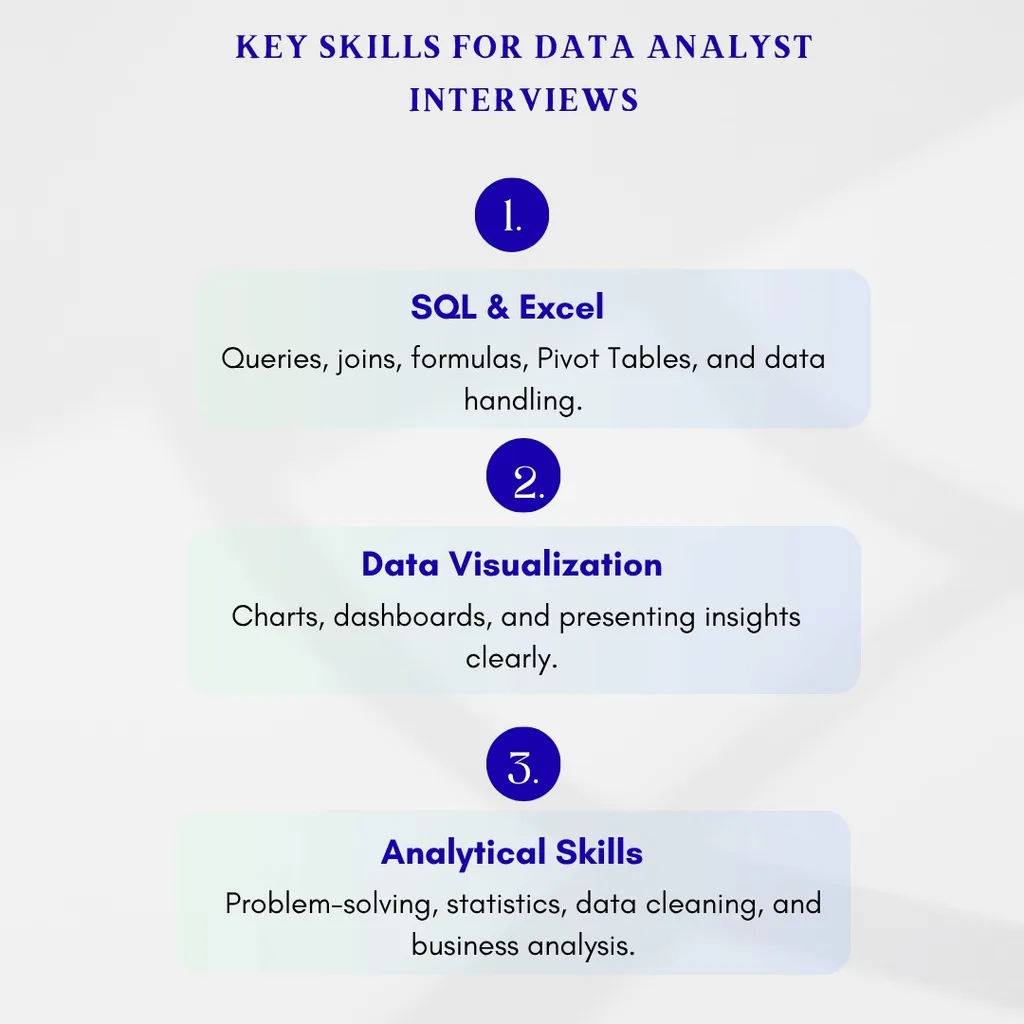
Preparing for Data Analyst Interview Questions and Answers for Freshers requires a combination of technical knowledge, analytical thinking, and communication skills. Focus first on SQL, Excel, data cleaning, statistics, and visualization, then strengthen your knowledge of Python and cloud technologies.
Freshers should also practice solving business scenarios instead of relying only on theoretical preparation. Being able to explain how you approach a problem, validate data, identify patterns, and communicate insights can make a strong impression during an interview.
Frequently Asked Questions
1. Is SQL necessary for a data analyst fresher?
Yes. SQL is one of the most important skills for many entry-level data analyst roles because analysts frequently retrieve and manipulate information stored in databases.
2. Is Excel enough to become a data analyst?
Excel is an important starting point, but learning SQL, statistics, data visualization, and ideally Python can provide a stronger foundation for a data analyst career.
3. What should freshers prepare first for a data analyst interview?
Start with SQL, Excel, basic statistics, data cleaning, visualization, and common analytical scenarios. After that, practice solving real-world datasets.
4. Do data analysts need Python?
Python is not mandatory for every data analyst position, but it is increasingly useful for data cleaning, automation, statistical analysis, and working with larger datasets.
5. How can I prepare for a data analyst interview?
Practice SQL queries, Excel exercises, visualization concepts, statistics, and scenario-based questions. Also prepare to explain your projects, analytical approach, and the business impact of your findings.
