


Best DevOps monitoring tools help development and operations teams track application performance, identify infrastructure issues, and maintain reliable software delivery. As businesses increasingly rely on cloud platforms, microservices, and automated deployments, choosing the right monitoring solution has become essential.
These tools provide real-time insights into system health, server performance, application errors, and deployment activities. In this article, we explore the 10 best DevOps monitoring tools in 2026, their key features, and how to choose the right solution for your organization.
Table of Contents
What Are DevOps Monitoring Tools?
DevOps monitoring tools are software solutions that collect and analyze data from applications, servers, networks, databases, and cloud infrastructure. They help teams detect unusual behavior, investigate incidents, and identify performance bottlenecks before they significantly affect users.
Modern monitoring platforms often support metrics, logs, traces, dashboards, and automated alerts. These capabilities help engineering teams understand what is happening across their environments and respond to problems more efficiently.
The main objective is to improve system reliability, reduce downtime, and support continuous integration and continuous delivery (CI/CD) workflows.
10 Best DevOps Monitoring Tools in 2026
1. Datadog
Datadog is a cloud-based monitoring and observability platform designed for organizations that need visibility across applications, infrastructure, containers, and cloud services.
Its features include infrastructure monitoring, application performance monitoring (APM), log management, distributed tracing, and customizable dashboards. Teams can correlate information from different systems to investigate incidents more effectively.
Best for: Organizations managing complex cloud environments and distributed applications.
Key advantage: Broad integrations and centralized visibility across multiple technologies.
Limitation: Costs can increase as monitored infrastructure, logs, and other data volumes grow.
2. Prometheus
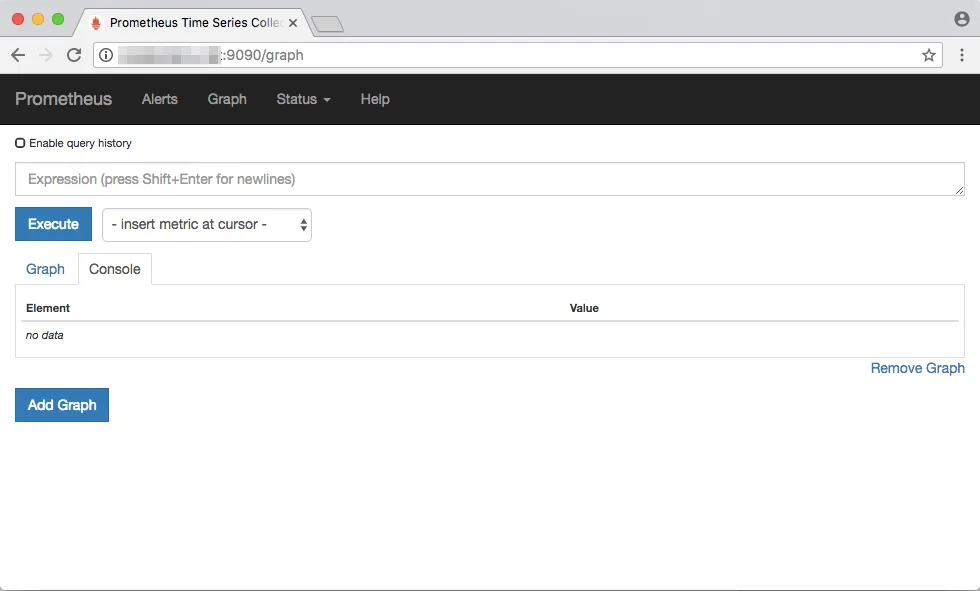
Prometheus is an open-source monitoring system widely used for collecting and querying time-series metrics. It is particularly popular in cloud-native environments and Kubernetes deployments.
Prometheus collects numerical measurements, stores them as time-series data, and uses PromQL to query performance information. Teams can configure alerting rules to identify conditions such as high CPU usage, increased request latency, or unavailable services.
Best for: Engineering teams that want flexible, open-source metrics monitoring.
Key advantage: Powerful queries, flexible alerting, and strong cloud-native ecosystem support.
Limitation: Logs and distributed traces generally require additional tools.
3. Grafana
Grafana is an observability and visualization platform that helps teams transform monitoring data into dashboards and meaningful insights.
It integrates with data sources such as Prometheus and Elasticsearch, allowing engineers to visualize system metrics, application performance, and operational trends in one interface.
Grafana can also support alerting and incident investigation when configured with compatible data sources and integrations.
Best for: Teams that need customizable dashboards and centralized visualization.
Key advantage: Flexible dashboards and extensive data-source integrations.
Limitation: Grafana generally relies on connected data sources to collect and store monitoring information.
4. New Relic
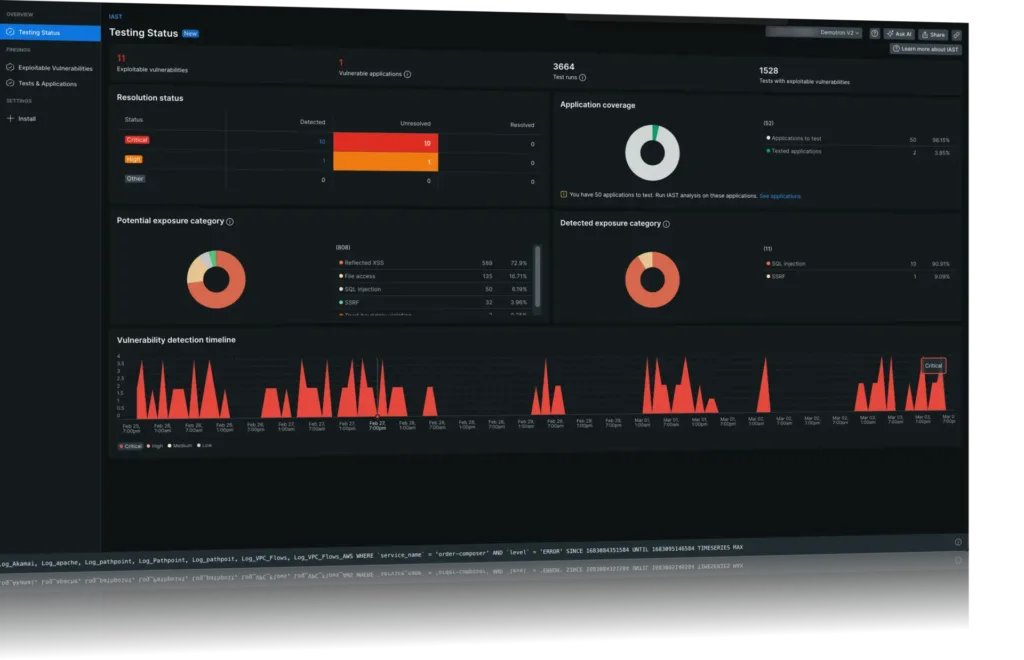
New Relic is an observability platform that helps teams monitor applications, infrastructure, logs, and distributed systems.
It offers application performance monitoring, infrastructure monitoring, distributed tracing, error tracking, and alerting capabilities. Developers can use its query tools to investigate performance problems and identify services that require attention.
New Relic is useful when teams want to connect application behavior with infrastructure performance and deployment changes.
Best for: Development teams seeking application-focused, full-stack observability.
Key advantage: A broad set of monitoring capabilities in one platform.
Limitation: Teams should evaluate usage-based costs and access requirements before scaling.
5. Dynatrace
Dynatrace is an enterprise observability platform designed to monitor complex applications and infrastructure environments.
It provides application performance monitoring, infrastructure visibility, distributed tracing, and automated analysis of relationships between system components. Its automation and AI-assisted capabilities can help teams investigate incidents and narrow down potential root causes.
Best for: Large enterprises with complex, interconnected applications.
Key advantage: Automated discovery and advanced performance analysis.
Limitation: Pricing and implementation complexity may make it less suitable for smaller teams.
6. Zabbix
Zabbix is an open-source monitoring solution for servers, networks, applications, databases, and other infrastructure components.
It supports data collection, configurable alerts, dashboards, and historical performance analysis. Organizations can deploy it in self-managed environments and customize monitoring according to their operational requirements.
Zabbix is particularly useful for teams that need detailed infrastructure monitoring without depending entirely on a commercial SaaS platform.
Best for: Organizations monitoring servers, networks, and on-premises infrastructure.
Key advantage: Flexible monitoring with no software license fee for the open-source edition.
Limitation: Initial configuration, maintenance, and advanced customization can require technical expertise.
7. Elastic Observability
Elastic Observability uses the Elastic ecosystem to help teams collect, search, and analyze logs, metrics, and application performance data.
Its search and analytics capabilities are useful for investigating errors across distributed applications. Teams can explore large volumes of log data, create visualizations, and connect operational events with application behavior.
Best for: Teams that rely heavily on log analysis and searchable operational data.
Key advantage: Powerful search capabilities and flexible analytics.
Limitation: Data ingestion, storage, and infrastructure management can require careful planning.
8. Splunk Observability Cloud
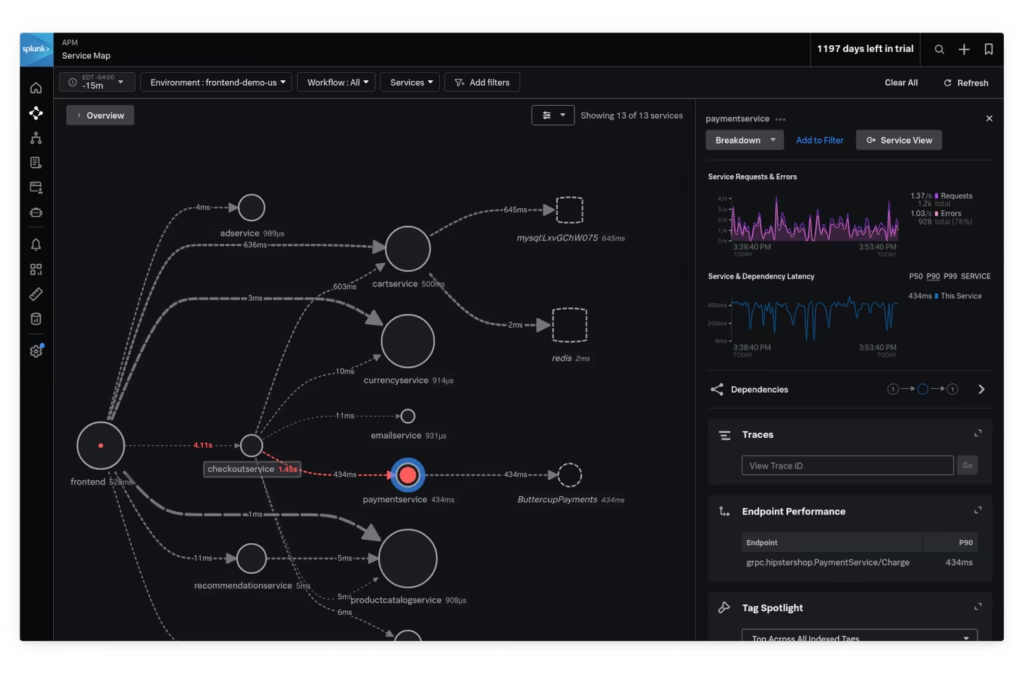
Splunk Observability Cloud helps organizations monitor applications, infrastructure, and distributed systems. Its capabilities include infrastructure monitoring, application performance monitoring, and distributed tracing.
The platform can help engineers investigate service-level issues and understand performance across complex environments. Organizations already using Splunk products may benefit from integrating monitoring with their existing operational workflows.
Best for: Large organizations that need enterprise-grade observability and analytics.
Key advantage: Advanced monitoring and investigation capabilities.
Limitation: Pricing and platform complexity should be evaluated against the organization’s monitoring requirements.
9. Nagios
Nagios is an established monitoring solution used to monitor infrastructure, networks, servers, and service availability.
It supports checks, notifications, and plugins that allow teams to monitor a wide range of system components. Nagios is useful for identifying service failures and infrastructure problems before they cause prolonged disruptions.
Best for: Teams that prioritize infrastructure health and availability monitoring.
Key advantage: Extensible monitoring through plugins and configurable checks.
Limitation: Advanced dashboards and complex monitoring setups may require additional configuration or integrations.
10. Amazon CloudWatch
Amazon CloudWatch is AWS’s monitoring and observability service for collecting metrics, logs, and events from supported AWS resources and applications.
It helps teams monitor resource utilization, configure alarms, visualize operational data, and investigate problems in AWS environments. CloudWatch integrates with other AWS services, making it a practical choice for organizations already operating on Amazon Web Services.
Best for: Teams running applications and infrastructure primarily on AWS.
Key advantage: Native integration with the AWS ecosystem.
Limitation: Monitoring environments outside AWS may require additional integrations or separate platforms.
Comparison of the Best DevOps Monitoring Tools
| Tool | Best use case | Main strength |
|---|---|---|
| Datadog | Multi-cloud monitoring | Broad integrations |
| Prometheus | Metrics collection | Open-source flexibility |
| Grafana | Dashboards | Data visualization |
| New Relic | Application monitoring | Full-stack observability |
| Dynatrace | Enterprise systems | Automated analysis |
| Zabbix | Infrastructure monitoring | Customizable monitoring |
| Elastic Observability | Log analysis | Search and analytics |
| Splunk Observability Cloud | Enterprise observability | Advanced investigation |
| Nagios | Availability monitoring | Plugin-based checks |
| Amazon CloudWatch | AWS environments | Native AWS integration |
How to Choose the Right DevOps Monitoring Tools?
Selecting suitable DevOps monitoring tools depends on your infrastructure, team expertise, budget, and operational goals.
1. Identify your monitoring requirements. Determine whether you primarily need application performance monitoring, infrastructure monitoring, log analysis, distributed tracing, or a combination of these capabilities.
2. Evaluate integrations. Check compatibility with your cloud provider, CI/CD pipeline, container platform, databases, and incident management systems.
3. Consider scalability. Choose a solution that can handle increasing workloads, additional services, and growing volumes of monitoring data.
4. Compare total costs. Open-source software may reduce licensing expenses, but hosting, maintenance, and engineering time still have costs. Commercial platforms may reduce operational overhead but charge according to usage, hosts, or features.
5. Configure actionable alerts. Prioritize alerts that indicate meaningful performance degradation or service risks. Poorly configured alerts can overwhelm engineers and delay incident response.
Benefits of Using DevOps Monitoring Tools
The right monitoring setup can improve software delivery and operational reliability in several ways:
- Faster troubleshooting: Helps engineers identify errors and performance bottlenecks.
- Reduced downtime: Alerts teams to potential problems before they become major incidents.
- Better performance: Reveals resource constraints, slow requests, and infrastructure inefficiencies.
- Improved collaboration: Gives development and operations teams shared visibility into system behavior.
- Informed decisions: Historical metrics and logs support capacity planning and performance optimization.
Effective monitoring is not simply about collecting more data. It is about turning useful information into timely action.
Frequently Asked Questions (FAQs)
1. What are the best DevOps monitoring tools in 2026?
Popular options include Datadog, Prometheus, Grafana, New Relic, Dynatrace, Zabbix, Elastic Observability, Splunk Observability Cloud, Nagios, and Amazon CloudWatch. The best choice depends on your infrastructure, budget, and monitoring needs.
2. Are there free DevOps monitoring tools?
Yes. Prometheus, Grafana’s open-source edition, Zabbix, and Nagios Core offer open-source options. However, hosting, maintenance, storage, and operational support may still involve costs.
3. What is the difference between monitoring and observability?
Monitoring tracks predefined metrics and conditions to identify problems. Observability uses metrics, logs, traces, and other telemetry to help engineers investigate system behavior and understand why a problem occurred. The two concepts overlap and often work together.
4. Which DevOps monitoring tool is best for Kubernetes?
Prometheus is a popular choice for Kubernetes metrics, while Grafana provides visualization. Datadog, New Relic, and Dynatrace offer broader managed observability capabilities. The best option depends on your team’s expertise, infrastructure, and budget.
Conclusion
The best DevOps monitoring tools help teams maintain reliable applications, identify performance issues, and respond to incidents efficiently. Datadog and Dynatrace are worth evaluating for complex enterprise environments, Prometheus and Grafana offer flexible open-source monitoring, and Amazon CloudWatch is a natural option for AWS-focused teams.
Before choosing a platform, assess your monitoring requirements, integration needs, scalability, and total cost of ownership. A well-configured monitoring strategy can help your team improve application performance, reduce downtime, and deliver better software experiences in 2026.
