


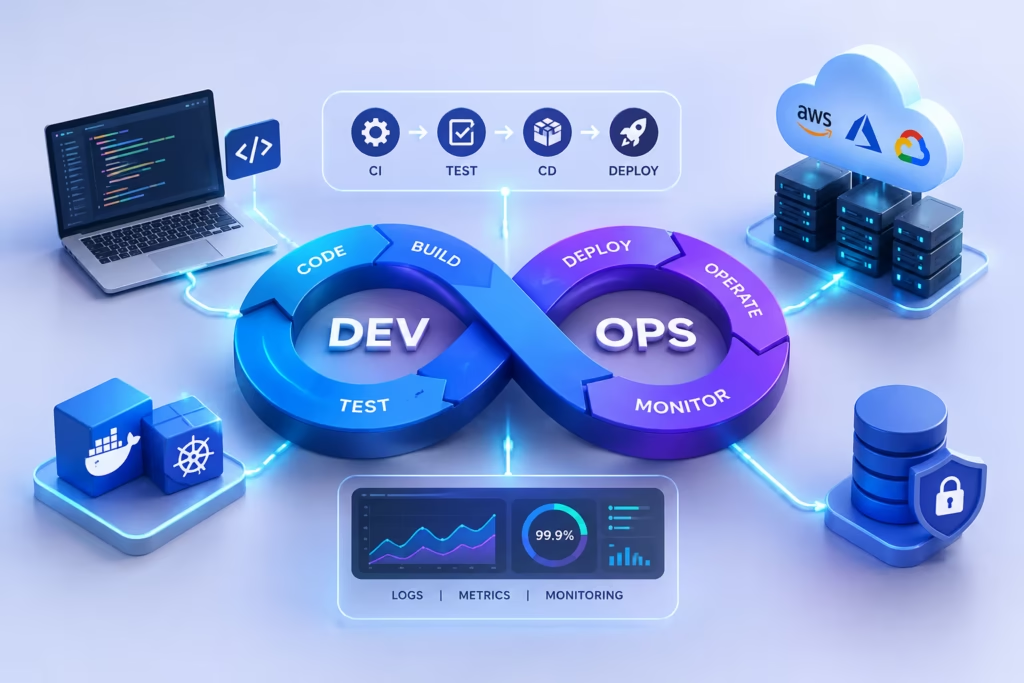
DevOps monitoring tools help teams track container health, monitor application performance, identify infrastructure problems, and maintain reliable deployments. In modern cloud-native environments, Kubernetes and Docker make it easier to build, package, deploy, and scale applications. However, managing multiple containers and distributed services also introduces monitoring challenges.
The right tools help engineers detect failures, investigate performance bottlenecks, and maintain visibility across their infrastructure. In this guide, we explore the best DevOps monitoring tools for Kubernetes and Docker environments, compare their features, and explain how to choose the right solution for your team.
Table of Contents
Why Do Kubernetes and Docker Environments Need Monitoring?
Docker packages applications and their dependencies into containers, while Kubernetes orchestrates containers across clusters of machines. Together, they support scalable and portable application deployments.
However, containerized environments can become difficult to manage as applications grow. Containers may restart unexpectedly, consume excessive memory, experience network issues, or fail because of insufficient resources.
Kubernetes introduces additional components, including pods, nodes, deployments, and services, that require monitoring.
Effective monitoring helps teams:
- Detect unhealthy containers and failed deployments.
- Track CPU and memory consumption.
- Identify application errors and performance bottlenecks.
- Monitor Kubernetes nodes, pods, and workloads.
- Configure alerts for abnormal system behavior.
- Improve application availability and resource utilization.
Without proper monitoring, diagnosing a problem across hundreds of containers can become time-consuming and complicated.
10 Best DevOps Monitoring Tools for Kubernetes and Docker

1. Prometheus
Prometheus is an open-source monitoring system widely used for Kubernetes and cloud-native infrastructure. It collects time-series metrics from applications and infrastructure components and supports powerful queries through PromQL.
Prometheus can monitor CPU usage, memory consumption, request rates, error rates, and other operational measurements. It also supports alerting rules that can notify teams when specific conditions occur.
Key features:
- Time-series metrics collection.
- PromQL queries.
- Alerting integrations.
- Strong Kubernetes ecosystem support.
Best for: Teams that want flexible, open-source metrics monitoring.
Limitation: Logs and distributed traces typically require additional tools.
2. Grafana
Grafana is a visualization and observability platform that helps teams turn monitoring data into dashboards.
It is frequently used with Prometheus to display Kubernetes cluster health, container resource usage, application latency, and operational trends. Grafana also supports numerous other data sources.
Key features:
- Customizable dashboards.
- Kubernetes monitoring visualizations.
- Alerting capabilities.
- Integrations with metrics and logging systems.
Best for: Teams that need clear dashboards and centralized monitoring views.
Limitation: Grafana generally relies on connected data sources for collecting and storing monitoring information.
3. Datadog
Datadog is a commercial observability platform that provides infrastructure monitoring, application performance monitoring, log management, and distributed tracing.
Its Kubernetes monitoring capabilities help teams investigate pod restarts, resource consumption, deployment changes, and application performance across distributed environments.
Key features:
- Container and Kubernetes monitoring.
- Application performance monitoring.
- Log analysis and distributed tracing.
- Cloud integrations and alerting.
Best for: Organizations seeking managed, full-stack observability.
Limitation: Costs may increase with monitored infrastructure, data ingestion, and selected features.
4. New Relic
New Relic provides application and infrastructure monitoring with capabilities for analyzing metrics, logs, errors, and distributed traces.
Teams can use it to investigate slow services, monitor application behavior, and understand performance across containerized workloads.
Key features:
- Application performance monitoring.
- Infrastructure visibility.
- Distributed tracing.
- Dashboards and alerts.
Best for: Development teams that want application-focused observability.
Limitation: Pricing and data limits depend on the current plan and usage.
5. Dynatrace
Dynatrace offers enterprise observability capabilities for applications, infrastructure, and distributed systems. Its automated discovery and AI-assisted analysis can help teams investigate relationships between services and infrastructure components.
For Kubernetes and Docker deployments, it can provide visibility into containerized workloads and application dependencies.
Key features:
- Container and infrastructure monitoring.
- Application performance analysis.
- Distributed tracing.
- Automated discovery and AI-assisted insights.
Best for: Enterprises operating complex containerized applications.
Limitation: Cost and implementation complexity may be higher than simpler monitoring setups.
6. Kubernetes Dashboard
Kubernetes Dashboard is a web-based user interface for managing and inspecting Kubernetes clusters. It helps users view resources such as pods, deployments, services, and nodes.
It is useful for checking resource status and investigating basic cluster issues, although it is not a complete replacement for a dedicated observability platform.
Key features:
- Kubernetes resource visualization.
- Inspection of pods and deployments.
- Basic resource management.
- Cluster status visibility.
Best for: Beginners who need a graphical view of Kubernetes resources.
Limitation: Advanced historical metrics, log analysis, and distributed tracing require other solutions. Secure configuration and access controls are essential.
7. cAdvisor
cAdvisor, short for Container Advisor, collects resource usage and performance information from running containers.
It can provide measurements such as CPU usage, memory consumption, and network activity. Its metrics are commonly used as part of broader container monitoring setups.
Key features:
- Container resource measurements.
- CPU and memory statistics.
- Network usage information.
- Integration with metrics collection systems.
Best for: Teams that need container-level resource visibility.
Limitation: It is primarily a metrics collection component rather than a complete monitoring platform.
8. Zabbix
Zabbix is an open-source monitoring solution for servers, networks, applications, and infrastructure components.
It can be useful for organizations managing both traditional infrastructure and containerized workloads. Teams can configure checks, dashboards, and alerts based on their environments.
Key features:
- Infrastructure monitoring.
- Custom checks and alerting.
- Historical data analysis.
- Dashboard-based visibility.
Best for: Organizations monitoring mixed IT environments.
Limitation: Container-specific visibility may require appropriate integrations and additional configuration.
9. Elastic Observability
Elastic Observability helps teams collect and analyze logs, metrics, and traces. Its search capabilities are particularly useful when investigating errors across multiple services.
For Kubernetes and Docker environments, centralized logs can help engineers identify container failures, application exceptions, and recurring error patterns.
Key features:
- Centralized log management.
- Metrics and trace analysis.
- Search and filtering.
- Dashboards and alerting.
Best for: Teams that need detailed log investigation across distributed applications.
Limitation: Data ingestion, retention, and infrastructure requirements need careful planning.
10. Amazon CloudWatch Container Insights
Amazon CloudWatch Container Insights provides monitoring capabilities for supported containerized workloads in AWS environments, including Amazon EKS and other supported container services.
It helps teams collect and visualize operational metrics and investigate issues across supported container infrastructure.
Key features:
- Container and cluster metrics.
- AWS service integration.
- Dashboards and alarms.
- Operational visibility for supported workloads.
Best for: Teams running Kubernetes and containerized applications on AWS.
Limitation: Costs depend on the data collected and related CloudWatch features. Non-AWS environments may require additional solutions.
Comparison of the Best Monitoring Tools
| Tool | Best use case | Main strength |
|---|---|---|
| Prometheus | Kubernetes metrics | Flexible metrics collection |
| Grafana | Dashboards | Data visualization |
| Datadog | Full-stack observability | Integrated monitoring |
| New Relic | Application monitoring | Performance investigation |
| Dynatrace | Enterprise workloads | Automated analysis |
| Kubernetes Dashboard | Cluster inspection | Kubernetes resource visibility |
| cAdvisor | Container metrics | Resource usage data |
| Zabbix | Infrastructure monitoring | Flexible checks and alerts |
| Elastic Observability | Log analysis | Searchable operational data |
| CloudWatch Container Insights | AWS containers | Native AWS integration |
How to Choose the Right Monitoring Tool?

Choosing among DevOps monitoring tools depends on your technical requirements, budget, and infrastructure.
1. Identify what you need to monitor. Decide whether you need container metrics, Kubernetes cluster health, application performance, centralized logs, or distributed tracing.
2. Consider integrations. Ensure the solution works with your Kubernetes distribution, Docker workloads, cloud provider, databases, and CI/CD pipeline.
3. Evaluate scalability. Choose a platform that can handle additional clusters, workloads, and growing telemetry volumes.
4. Compare total costs. Open-source tools may reduce licensing expenses, but hosting, maintenance, and engineering time still matter. Commercial tools can simplify operations but introduce ongoing subscription or usage costs.
5. Review security and access controls. Monitoring systems may contain sensitive logs and operational data. Use appropriate permissions, secure credentials, and retention policies.
6. Test alert quality. Configure alerts for meaningful failures, such as unavailable workloads or sustained resource pressure, rather than generating excessive notifications.
Best Practices for Kubernetes and Docker Monitoring
To build a reliable monitoring strategy, follow these practices:
- Monitor CPU, memory, network activity, and container restarts.
- Track Kubernetes node, pod, and deployment health.
- Collect application logs centrally for easier investigation.
- Use metrics, logs, and traces together when troubleshooting.
- Establish performance baselines before setting alert thresholds.
- Monitor the impact of deployments and configuration changes.
- Review resource requests and limits to reduce resource contention.
- Secure dashboards, monitoring endpoints, and stored telemetry.
For many teams, Prometheus and Grafana provide a practical starting point. Additional tools can be introduced as requirements grow, such as centralized log management or commercial application performance monitoring.
Frequently Asked Questions (FAQs)
1. What are the best DevOps monitoring tools for Kubernetes?
Prometheus and Grafana are popular for Kubernetes metrics and dashboards. Datadog, New Relic, and Dynatrace offer broader observability capabilities, while CloudWatch Container Insights is useful for supported AWS container environments.
2. Can Prometheus monitor Docker containers?
Yes. Prometheus can collect container metrics from compatible exporters and instrumentation. cAdvisor is one commonly used source of container resource metrics, although the exact setup depends on the environment.
3. Are there free monitoring tools for Kubernetes and Docker?
Yes. Prometheus, Grafana’s open-source edition, cAdvisor, Kubernetes Dashboard, and Zabbix offer open-source options. However, infrastructure, maintenance, storage, and support may still incur costs.
4. What is the difference between container monitoring and Kubernetes monitoring?
Container monitoring focuses on individual containers and their resource usage. Kubernetes monitoring includes containers but also examines cluster nodes, pods, deployments, scheduling, and other orchestration components.
Conclusion
The best DevOps monitoring tools for Kubernetes and Docker environments help teams understand container health, detect failures, investigate performance bottlenecks, and maintain reliable deployments. Prometheus and Grafana offer a flexible starting point, while Datadog, New Relic, and Dynatrace provide broader managed observability options.
Tools such as cAdvisor, Kubernetes Dashboard, and CloudWatch Container Insights can address more specialized monitoring needs.
Choose a solution based on your environment, monitoring requirements, technical expertise, and total cost of ownership. A well-planned monitoring strategy makes containerized applications easier to manage, troubleshoot, and scale.
