


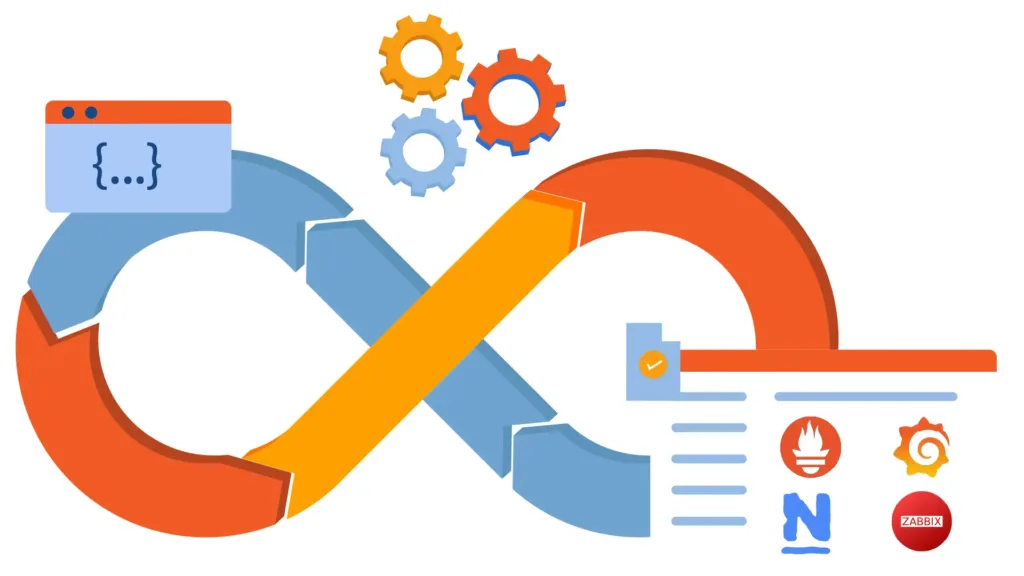
DevOps monitoring tools help teams identify technical problems, investigate their root causes, and restore applications quickly. In modern software environments, even a small error can affect user experience, disrupt business operations, or cause unexpected downtime.
Monitoring tools provide real-time visibility into application behavior, infrastructure health, and system performance, allowing teams to respond before minor issues become major incidents. By combining automated alerts, dashboards, logs, and performance metrics, organizations can improve troubleshooting, reduce recovery time, and deliver more reliable software.
Table of Contents
What Are DevOps Monitoring Tools?
DevOps monitoring tools are software solutions that collect and analyze information from applications, servers, databases, networks, containers, and cloud infrastructure. They help teams understand how systems behave during development, testing, deployment, and production.
For example, imagine an online shopping website suddenly becomes slow during a sale. Monitoring tools can reveal whether the problem comes from high server utilization, slow database queries, network latency, or application errors.
Instead of relying on customer complaints or manually checking every component, engineers can use monitoring data to identify suspicious behavior and investigate the problem systematically.
These tools support continuous monitoring, which is an important part of modern DevOps practices.
Why Is Fast Issue Detection Important in DevOps?
Software systems are constantly changing. Developers release new features, teams update infrastructure, and applications handle fluctuating workloads. Although these changes improve products, they can also introduce unexpected problems.
Fast issue detection matters for several reasons.
1. Reduced downtime: Early warnings help teams respond to failures before they cause extended service interruptions.
2. Better user experience: Identifying slow response times and application errors helps maintain reliable digital services.
3. Lower operational costs: Faster troubleshooting can reduce the time engineers spend investigating incidents.
4. Improved productivity: Automated monitoring reduces the need for repetitive manual checks.
5. Safer deployments: Teams can identify performance regressions after software releases and investigate them before they affect more users.
When teams detect problems earlier, they have a better opportunity to limit their impact and restore normal operations.
7 Ways DevOps Monitoring Tools Help Teams Detect and Fix Issues Faster
1. Real-Time Monitoring Identifies Problems Early
One of the biggest advantages of DevOps monitoring tools is their ability to collect performance data continuously.
They can track CPU utilization, memory consumption, application response times, request volumes, and error rates. When these measurements move outside expected limits, engineers can investigate before the situation becomes critical.
For example, if memory usage increases steadily after a deployment, monitoring data may reveal a memory leak or an inefficient application process.
Real-time visibility allows teams to detect abnormal behavior sooner rather than waiting for users to report problems.
2. Automated Alerts Reduce Response Time
Manually checking dashboards throughout the day is inefficient, especially when teams manage many applications and services.
Monitoring platforms allow engineers to configure automated alerts for important conditions, including unavailable services, elevated error rates, high latency, and resource exhaustion.
Alerts can be delivered through email, messaging applications, or incident management systems, depending on the platform and configuration.
However, alerts should be meaningful. Too many notifications can create alert fatigue, making it harder for engineers to recognize urgent incidents.
Teams should prioritize actionable alerts based on business impact, severity, and service-level objectives.
3. Logs Help Engineers Investigate Root Causes
Metrics can indicate that something is wrong, but they may not explain why the problem occurred.
Application and infrastructure logs provide detailed records of events, warnings, exceptions, and failures. Engineers can examine these records to understand what happened before and during an incident.
For example, an increase in failed API requests may be associated with authentication errors, database connection failures, or invalid application inputs.
Log management platforms make it easier to search large volumes of records and identify patterns across services.
Combining logs with monitoring metrics can significantly improve troubleshooting accuracy and help teams avoid repeated guesswork.
4. Distributed Tracing Reveals Bottlenecks
Modern applications often consist of multiple interconnected services. A single user request may pass through an API gateway, application service, database, and external payment provider.
When one component becomes slow, identifying the source of the delay can be difficult.
Distributed tracing follows requests as they move between services. It shows how much time individual components spend processing a request and where delays occur.
For example, a checkout page may respond slowly because the payment service takes several seconds to return a result. Tracing helps engineers isolate that component rather than unnecessarily modifying the entire application.
This is particularly useful for microservices architectures and cloud-native applications.
5. Dashboards Improve Visibility Across Systems
Centralized dashboards bring important performance information together in one place.
Instead of checking separate systems manually, engineers can review application health, server performance, traffic patterns, error rates, and service availability through a common interface.
Dashboards also help teams compare current performance with historical baselines. A sudden increase in response time or resource consumption becomes easier to recognize when normal behavior is clearly documented.
Well-designed dashboards should focus on essential indicators rather than displaying every available measurement.
This shared visibility also helps development, operations, and reliability teams collaborate during incidents.
6. Performance Monitoring Helps Prevent Recurring Issues

Fixing an incident is only part of the process. Teams must also understand why it happened and determine whether similar failures could occur again.
Application performance monitoring helps engineers identify slow transactions, inefficient database queries, memory problems, and other bottlenecks.
After applying a fix, teams can compare performance measurements before and after the change to verify whether the solution worked.
Historical data can also reveal recurring patterns, such as resource exhaustion during peak traffic or performance degradation after specific releases.
This information supports long-term optimization and helps prevent the same issues from repeatedly disrupting services.
7. Integration With CI/CD Improves Deployment Reliability
Continuous integration and continuous delivery (CI/CD) pipelines automate software building, testing, and deployment. Monitoring adds valuable visibility after changes are introduced.
When monitoring tools are integrated with deployment workflows, teams can observe how a new release affects application performance and error rates.
For example, if a deployment causes a sudden increase in failed requests, engineers can investigate the change and, where supported by their deployment process, initiate a rollback.
Some platforms also support deployment annotations, release comparisons, and automated actions through integrations.
This combination of CI/CD and monitoring helps teams detect regressions quickly and make deployment decisions based on evidence.
Popular DevOps Monitoring Tools for Faster Troubleshooting
Several tools offer capabilities that support incident detection and investigation.
| Tool | How it helps |
|---|---|
| Prometheus | Collects time-series metrics and supports alerting rules |
| Grafana | Visualizes monitoring data through dashboards and alerts |
| Datadog | Combines infrastructure monitoring, logs, and application performance monitoring |
| New Relic | Helps investigate application errors and performance bottlenecks |
| Dynatrace | Provides application observability and automated analysis |
| Elastic Observability | Supports searching and analyzing logs, metrics, and traces |
| Amazon CloudWatch | Monitors supported AWS resources, applications, logs, and alarms |
The right choice depends on your infrastructure, budget, team expertise, and monitoring requirements. Some organizations combine multiple tools because no single platform is necessarily the best option for every monitoring task.
Best Practices for Faster Issue Resolution

To get better results from monitoring, teams should follow a consistent process.
Set useful performance baselines. Understand normal response times, traffic levels, error rates, and resource consumption so unusual behavior is easier to identify.
Prioritize critical services. Monitor business-critical applications and user-facing services before expanding to less important components.
Create actionable alerts. Configure thresholds and notifications that reflect meaningful risks instead of generating alerts for every minor fluctuation.
Correlate metrics, logs, and traces. Using these data sources together helps teams understand both the symptoms and the likely causes of incidents.
Document incident procedures. Clear troubleshooting steps help engineers respond consistently, particularly during high-severity incidents.
Review incidents after resolution. Analyze what happened, how quickly the team responded, and what changes could prevent recurrence.
Measure recovery time. Track metrics such as mean time to detect (MTTD) and mean time to restore or recover (MTTR), using clearly defined measurement periods. These metrics help teams evaluate whether their monitoring practices are improving.
Frequently Asked Questions (FAQs)
1. How do DevOps monitoring tools help teams fix issues faster?
They provide real-time metrics, automated alerts, searchable logs, dashboards, and distributed traces. These capabilities help engineers detect problems, narrow down potential causes, and verify fixes more efficiently.
2. What is the difference between monitoring and troubleshooting?
Monitoring identifies abnormal conditions and provides visibility into system behavior. Troubleshooting is the process of investigating those conditions, determining their causes, and implementing corrective actions. Monitoring data supports troubleshooting.
3. Which DevOps monitoring tools are best for beginners?
Prometheus and Grafana are popular options for learning metrics, alerting, and dashboards. Datadog and New Relic offer broader managed monitoring capabilities, while Amazon CloudWatch is useful for AWS-based environments.
4. How can monitoring reduce application downtime?
Monitoring helps teams detect failures and performance degradation earlier, notify the appropriate engineers, and provide information needed to investigate incidents. Faster detection and recovery can reduce the duration and impact of downtime.
Conclusion
DevOps monitoring tools help teams detect and fix issues faster by providing real-time visibility, automated alerts, detailed logs, distributed tracing, and performance dashboards. These capabilities reduce the time spent identifying problems and help engineers investigate their causes more effectively.
By combining application performance monitoring with infrastructure monitoring, meaningful alerting, and reliable CI/CD practices, organizations can improve application reliability and reduce the impact of incidents. The most effective approach is to monitor critical services, prioritize actionable information, and continuously learn from every incident.
