



Open-source API monitoring tools help developers and businesses track API availability, identify performance issues, and maintain reliable application connections without depending entirely on expensive commercial platforms.
APIs (Application Programming Interfaces) allow different applications to communicate, exchange information, and perform essential operations. However, unexpected downtime, slow response times, and server errors can disrupt these connections and affect user experiences.
Open-source monitoring solutions provide access to source code, customization options, and the flexibility to host monitoring infrastructure on private servers. They are particularly useful for startups, independent developers, and DevOps teams looking to manage monitoring costs while maintaining control over their data.
Several platforms offer different capabilities, ranging from basic uptime checks to advanced application observability and performance tracking. This article explores 10 open-source API monitoring tools worth considering in 2027.
Table of Contents
Why Choose Open-Source API Monitoring Tools?
Businesses often rely on APIs for payment processing, customer authentication, data exchange, and third-party integrations. Monitoring these connections helps ensure that applications continue working correctly.
Open-source solutions offer several advantages over traditional commercial monitoring platforms.
- Lower software costs: Many open-source platforms can be used without recurring software subscription fees.
- Customization: Developers can modify configurations and adapt monitoring workflows.
- Data control: Self-hosted solutions allow businesses to maintain greater control over monitoring data.
- Community support: Popular projects benefit from community contributions, documentation, and integrations.
- Flexible deployment: Many tools support Docker, Linux servers, and cloud infrastructure.
However, self-hosting still requires infrastructure, maintenance, backups, and technical expertise.
10 Best Open-Source API Monitoring Tools to Try in 2027
Here are 10 solutions that developers can use to monitor API availability, performance, and application health.
1. Uptime Kuma
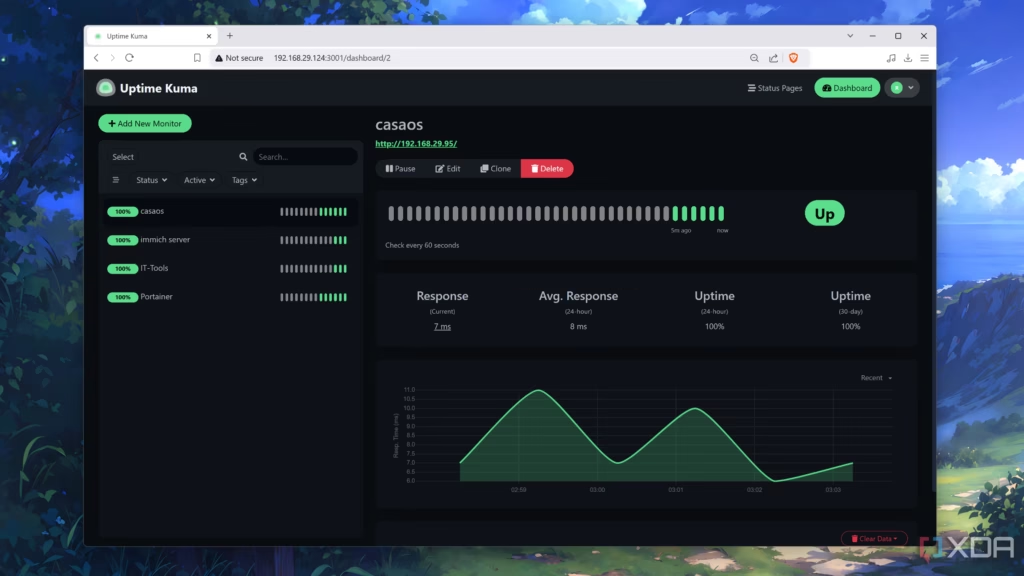
Uptime Kuma is a popular self-hosted monitoring platform designed to track service availability and performance. It offers a straightforward interface that allows users to configure monitoring checks without building a complicated monitoring environment.
The platform supports HTTP and HTTPS, TCP, DNS, ping, and other monitoring methods. Developers can also create status pages to share service availability with customers or internal teams.
Key features:
- HTTP and HTTPS monitoring.
- Automated downtime notifications.
- Multiple notification integrations.
- Public and private status pages.
- Self-hosted deployment.
Uptime Kuma is particularly suitable for small businesses, independent developers, and startups looking for an accessible monitoring solution.
Website: https://github.com/louislam/uptime-kuma
2. Prometheus
Prometheus is an open-source monitoring and alerting toolkit widely used in cloud-native environments. It collects and stores time-series metrics, allowing development teams to analyze application and infrastructure performance.
Although Prometheus does not directly perform every type of external API availability check by itself, developers can integrate it with the Blackbox Exporter to monitor HTTP, HTTPS, DNS, TCP, and other endpoints.
Key features:
- Time-series metrics collection.
- Powerful PromQL query language.
- Custom alerting rules.
- Integration with monitoring exporters.
- Support for cloud-native environments.
Prometheus is a strong choice for DevOps teams managing complex infrastructure and applications.
Website: https://prometheus.io/
3. Gatus
Gatus is an open-source health monitoring tool designed to check endpoint availability and performance. One of its main advantages is its configuration-based approach, which allows developers to define monitoring checks using YAML files.
It supports HTTP, HTTPS, TCP, DNS, and other endpoint checks. Users can also configure conditions to determine whether a service is healthy.
Key features:
- Automated endpoint monitoring.
- YAML-based configuration.
- Custom health conditions.
- Alerting integrations.
- Built-in status dashboards.
Gatus is especially useful for developers who prefer monitoring as code and want to manage configurations through version control.
Website: https://github.com/TwiN/gatus
4. Grafana

Grafana is an open-source analytics and visualization platform that helps developers understand application and infrastructure performance through customizable dashboards.
It works with monitoring data collected by systems such as Prometheus and other supported data sources. Teams can create dashboards to visualize API response times, error rates, availability, and performance trends.
Key features:
- Customizable monitoring dashboards.
- Multiple data-source integrations.
- Alerting capabilities.
- Performance visualization.
- Historical data analysis.
Grafana is best suited for teams that need a centralized interface for analyzing API monitoring data. It generally works alongside dedicated monitoring and data-collection tools rather than replacing them.
Website: https://grafana.com/oss/grafana/
5. Netdata
Netdata is an open-source monitoring platform designed to provide real-time insights into system and application performance. It collects detailed metrics and presents them through interactive dashboards.
Developers can use Netdata to monitor infrastructure health, resource consumption, network activity, and application performance. It can also help identify infrastructure problems that affect API response times.
Key features:
- Real-time performance monitoring.
- Automated metric collection.
- Interactive dashboards.
- Infrastructure health tracking.
- Alerting and anomaly detection capabilities.
Netdata is a useful option for businesses that want detailed infrastructure monitoring alongside their API performance monitoring setup.
Website: https://www.netdata.cloud/
6. SigNoz
SigNoz is an open-source observability platform that helps developers analyze application performance using metrics, logs, and distributed traces.
It supports OpenTelemetry, making it useful for teams that want to collect telemetry data from different applications and services. Developers can use its dashboards and tracing capabilities to investigate slow API requests and identify performance bottlenecks.
Key features:
- Application performance monitoring.
- Distributed tracing.
- Metrics and log analysis.
- OpenTelemetry integration.
- Custom dashboards and alerts.
SigNoz is particularly suitable for organizations managing microservices and distributed applications.
Website: https://signoz.io/
7. Zabbix
Zabbix is an open-source monitoring platform designed to track servers, networks, applications, and other IT infrastructure components.
It provides several monitoring capabilities, including HTTP checks, web scenarios, performance tracking, and alert notifications. These features allow businesses to monitor the health of services that support their APIs.
Key features:
- HTTP and web monitoring.
- Infrastructure performance tracking.
- Automated notifications.
- Custom dashboards.
- Distributed monitoring capabilities.
Zabbix is a practical choice for organizations that need a broader infrastructure monitoring platform rather than a dedicated API monitoring solution.
Website: https://www.zabbix.com/
8. Nagios Core
Nagios Core is an open-source monitoring system used to monitor servers, network devices, applications, and services.
Its plugin-based architecture allows developers to extend monitoring capabilities according to their requirements. Teams can configure checks for HTTP endpoints, service availability, and other operational metrics.
Key features:
- Plugin-based monitoring.
- Service and host checks.
- Custom monitoring configurations.
- Alert notifications.
- Availability reporting.
Nagios Core is suitable for technical teams that prefer flexible configurations and have experience managing monitoring plugins.
Website: https://www.nagios.org/projects/nagios-core/
9. OpenStatus
OpenStatus is an open-source platform focused on uptime monitoring and service status pages. It helps businesses monitor endpoints and communicate service availability to customers.
Its monitoring capabilities support HTTP and other endpoint checks, while its status-page functionality allows teams to share information about service disruptions.
Key features:
- Endpoint availability monitoring.
- Customizable status pages.
- Monitoring automation.
- Alerting integrations.
- Self-hosting capabilities.
OpenStatus is worth considering for businesses that want to combine uptime monitoring with transparent service-status communication.
Website: https://github.com/openstatusHQ/openstatus
10. Upptime

Upptime is an open-source uptime monitoring solution built around GitHub Actions and GitHub Pages. It allows developers to monitor website and service availability through a GitHub repository.
The platform uses automated workflows to check endpoints and record availability information. Developers can also publish status pages using GitHub Pages.
Key features:
- GitHub-based monitoring.
- Automated uptime checks.
- Historical availability tracking.
- Status-page generation.
- Configuration through repository files.
Upptime is particularly useful for developers who already use GitHub and want a lightweight monitoring setup without managing a dedicated monitoring server.
Website: https://github.com/upptime/upptime
How to Choose the Right Open-Source API Monitoring Solution?
The best platform depends on your application requirements, technical expertise, and monitoring environment.
Before selecting a solution, consider the following factors:
1. Monitoring requirements: Determine whether you need basic endpoint checks, detailed response-time tracking, distributed tracing, or infrastructure monitoring.
2. Ease of deployment: Choose a platform that supports your existing environment, such as Docker, Linux, or Kubernetes.
3. Alerting capabilities: Check whether the solution supports notifications through email, Slack, or other communication platforms.
4. Scalability: Ensure the platform can handle additional endpoints, applications, and increasing monitoring requirements.
5. Community and documentation: Review project activity, documentation quality, security updates, and community support before deployment.
For straightforward uptime checks, Uptime Kuma and Gatus are good starting points. For more advanced monitoring, Prometheus with Blackbox Exporter and Grafana offers a flexible combination. SigNoz is worth exploring for teams that need broader observability.
Conclusion
Open-source API monitoring tools provide developers with flexible and customizable ways to track application availability, performance, and reliability. Solutions such as Uptime Kuma and Gatus simplify endpoint monitoring, while Prometheus, Grafana, and SigNoz support more advanced monitoring and observability requirements.
The right choice depends on the complexity of your infrastructure, monitoring goals, and available technical resources. Before making a decision, evaluate deployment requirements, integrations, alerting features, and ongoing maintenance needs.
By selecting an appropriate open-source monitoring solution, businesses can improve service reliability, identify technical problems faster, and maintain greater control over their monitoring infrastructure.
Frequently Asked Questions (FAQs)
1. What are open-source API monitoring tools?
Open-source API monitoring tools are software applications that allow developers to track API availability, response times, and performance using publicly available source code. Many can be self-hosted and customized according to business requirements.
2. Which is the best free and open-source API monitoring tool?
Uptime Kuma is a good starting point for basic uptime monitoring. Gatus is another useful option for configuration-based endpoint checks, while Prometheus with Blackbox Exporter is suitable for more advanced monitoring environments.
3. Can open-source API monitoring tools monitor REST APIs?
Yes. Several open-source solutions support HTTP and HTTPS endpoint checks, which can be used to monitor REST APIs. Some also support response validation, status-code checks, and performance measurements.
4. Are open-source API monitoring tools suitable for enterprises?
Yes. Platforms such as Prometheus, Grafana, SigNoz, and Zabbix can support complex monitoring environments. However, enterprise deployment requires proper configuration, infrastructure planning, security management, and ongoing maintenance.
