


In data analytics and statistics, standardizing raw data is often the first step toward drawing meaningful insights. The Z-score (or standard score) is a core statistical metric that measures how many standard deviations a specific data point lies away from the dataset’s mean.
Whether you are building machine learning models, conducting academic research, or analyzing business performance, understanding Z-scores enables you to evaluate individual values relative to an entire population, detect anomalies, and compare datasets across completely different scales.
What Is a Z-Score?
A Z-score standardizes individual values within a distribution by shifting the mean to $0$ and setting the standard deviation to $1$. This process creates a Standard Normal Distribution, allowing for direct comparisons between datasets that originally used different units or measurement scales.
- Positive Z-score: Indicates a value above the mean.
- Negative Z-score: Indicates a value below the mean.
- Z-score of 0: Indicates a value exactly equal to the mean.
Read more blog : Beyond the Bell Curve: A Deep Dive into the Central Limit Theorem
The Basic Z-Score Formula
To calculate the Z-score for an individual observation ($X$) in a dataset with mean $\mu$ and standard deviation $\sigma$:
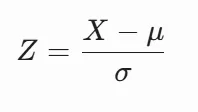
Where:
- $Z$ = Z-score (Standard Score)
- $X$ = Individual raw data point
- $\mu$ = Population mean
- $\sigma$ = Population standard deviation
Z-Score in Hypothesis Testing
When conducting hypothesis tests or building confidence intervals for a population mean ($\mu$) using a sample mean ($\bar{x}$), the Z-score calculation accounts for sample size ($n$).
Z-Score Formula for Sample Means
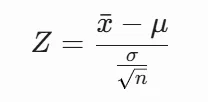
Where:
- $\bar{x}$ = Sample mean
- $\mu$ = Hypothesized population mean
- $\sigma$ = Population standard deviation
- $n$ = Sample size
- $\frac{\sigma}{\sqrt{n}}$ = Standard Error of the Mean (SEM)
The Standard Error of the Mean quantifies expected sampling variability. As sample size ($n$) increases, standard error decreases, making the Z-test more sensitive to minor deviations from the null hypothesis.
Standard Normal Distribution Interpretation
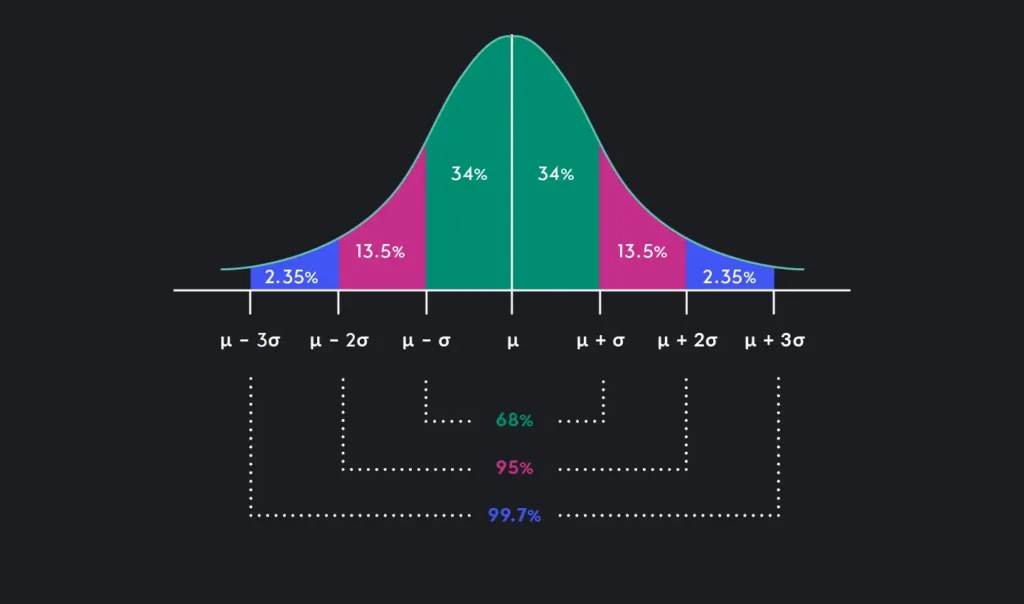
Understanding standard deviation coverage helps quickly classify data points based on their Z-scores in a normal bell curve.
| Z-Score Range | Percentile / Population Covered | Statistical Interpretation |
| $-1.00$ to $+1.00$ | ~68.27% of total data | Typical / Expected observation range |
| $-2.00$ to $+2.00$ | ~95.45% of total data | Moderate variation from average |
| $-3.00$ to $+3.00$ | ~99.73% of total data | Extreme threshold (Empirical 68-95-99.7 Rule) |
| Beyond $\pm 3.00$ | $< 0.27\%$ of total data | Statistical Outlier requiring further analysis |
Read more blog: 5 Key Principles of Database Normalization
Key Benefits of Using Z-Scores
- Data Normalization: Converts continuous variables with different scales (e.g., income in dollars vs. age in years) into dimensionless units suitable for machine learning algorithms like k-NN or Principal Component Analysis (PCA).
- Outlier Detection: Provides an objective, mathematical threshold (typically $\vert{}Z\vert{} > 3$) to identify data anomalies, fraud, or measuring errors.
- Probability & Percentile Mapping: Pairs directly with Z-tables or statistical algorithms to determine exact percentiles and tail probabilities.
- Standardized Benchmarking: Facilitates cross-industry performance metrics, such as comparing standardized test scores across different test versions or years.
Practical Applications Across Industries
- Finance & Risk Management: Altman’s Z-Score model evaluates financial metrics (liquidity, profitability, leverage) to predict corporate bankruptcy risk.
- Healthcare & Pediatrics: World Health Organization (WHO) growth charts use Z-scores to track infant height, weight, and nutritional development relative to global benchmarks.
- Quality Control & Manufacturing: Six Sigma protocols track process deviations in Z-scores to limit production defects to under 3.4 per million opportunities.
- Digital Marketing & UX Testing: Evaluates conversion rate changes across split tests (A/B testing) to confirm statistical significance over baseline noise.

Conclusion
In conclusion, the Z-score is a versatile and indispensable tool in the realm of statistics. Its ability to standardize data, identify outliers, and facilitate probabilistic calculations makes it invaluable for researchers, analysts, and decision-makers across various domains. By understanding and leveraging the power of Z-scores, one can gain deeper insights into datasets, make informed decisions, and drive meaningful outcomes in both research and practical applications. So, the next time you encounter a dataset, remember the mighty Z-score and its role in unlocking the secrets hidden within the numbers.
Frequently Asked Questions (FAQs)
1. What is the difference between a Z-score and a T-score?
A Z-score is used when the population standard deviation ($\sigma$) is known or when the sample size is large ($n \ge 30$). A T-score is used when the population standard deviation is unknown and the sample size is small ($n < 30$), relying instead on the sample standard deviation ($s$).
2. Can a Z-score be negative?
Yes. A negative Z-score simply means the data point falls below the population mean. For instance, a Z-score of $-1.5$ indicates the value is 1.5 standard deviations lower than average.
3. What does a Z-score of 0 mean?
A Z-score of 0 means the observed data point is equal to the population mean.
4. How do you find the probability corresponding to a Z-score?
You can look up the Z-score value in a standard normal distribution table (Z-table) or use statistical computing functions (e.g., norm.cdf() in Python or NORM.S.DIST() in Excel) to retrieve the cumulative probability.
5. Why is a Z-score threshold of $\pm 3$ commonly used for outliers?
Under a standard normal distribution, approximately 99.73% of all observations lie within 3 standard deviations of the mean. Values exceeding $\pm 3$ occur less than 0.27% of the time by random chance, making them strong candidates for outliers.
