


Network performance directly impacts page speed, Core Web Vitals, user retention, and search engine visibility. Google Chrome DevTools provides a built-in suite of diagnostic tools designed to inspect, debug, and optimize network requests in real time.
Understanding how to record requests, evaluate waterfall charts, simulate slow network conditions, and identify high-latency API calls allows developers and technical SEO specialists to isolate performance bottlenecks quickly.
Getting Started: Opening and Navigating the Network Panel
To open the Network panel in Google Chrome:
- Windows / Linux: Press
Ctrl + Shift + IorF12, then select the Network tab. - macOS: Press
Cmd + Option + I, then click Network. - Context Menu: Right-click anywhere on the webpage and select Inspect.
Core Controls in the Network Toolbar
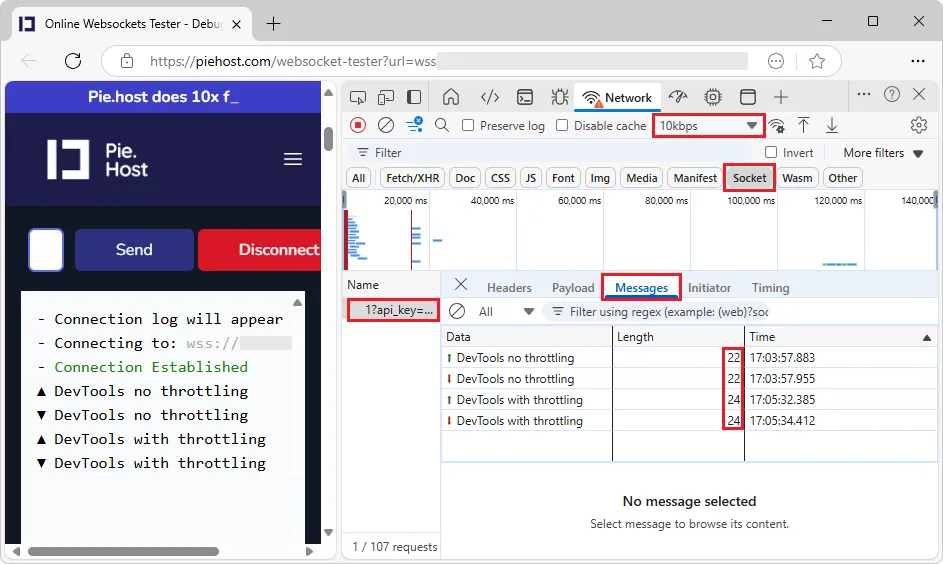
- Record Button (Red Circle): Toggles live network event recording on and off.
- Clear Log (Prohibited Symbol): Removes all captured requests from the current log.
- Disable Cache: Forces the browser to download all resources directly from the server on refresh rather than serving local cache assets.
- Preserve Log: Prevents DevTools from clearing the network history across page navigations and redirects.
- Throttling Dropdown: Emulates slower network environments such as Fast 3G, Slow 3G, or custom latency profiles.
Anatomy of the Requests Table
Every resource downloaded by the page appears as a row in the requests table. You can customize which columns are visible by right-clicking any column header.
| Column Name | Primary Function | Troubleshooting Focus |
| Name | Resource name and file path | Identifies specific scripts, stylesheets, or images |
| Status | HTTP response code (e.g., 200, 301, 404, 500) | Identifies broken links, failed API payloads, and redirect chains |
| Type | MIME type (Document, Script, Fetch/XHR, Font, Img) | Filters requests by asset type |
| Initiator | The script, parser, or process that triggered the call | Traces render-blocking chains and third-party script injectors |
| Size | Transferred size vs. uncompressed resource size | Pinpoints uncompressed assets and missing Gzip/Brotli encoding |
| Time | Total elapsed time from request start to completion | Flags high-latency dependencies |
| Waterfall | Visual breakdown of request phases | Analyzes DNS, TLS, TTFB, and download duration |
Read more blog : The Significance of HTTP Methods in Modern APIs
Decoding the Waterfall Chart
The Waterfall view breaks each HTTP request into distinct connection phases. Reading these phases reveals whether performance issues stem from server delays, network congestion, or browser queueing.
1. Queuing and Stalled
- Queued: The browser delays a request because higher-priority assets take precedence, or because the browser reached its limit of 6 simultaneous TCP connections per host (under HTTP/1.1).
- Stalled: Time spent waiting for an available socket connection, disk cache allocation, or proxy negotiation.
2. DNS Lookup and Initial Connection
- DNS Lookup: The time required to resolve the server IP address. High DNS times indicate slow name servers or an excessive number of unique third-party domains.
- Initial Connection (TCP Handshake & SSL/TLS): The time required to establish a TCP connection and negotiate SSL certificates.
3. Waiting (Time to First Byte – TTFB)
- TTFB: The duration from when the browser sends the request until it receives the first byte of response data from the server.
- Common Causes of High TTFB: Slow database queries, unoptimized server-side rendering, inadequate server resources, or lack of a Content Delivery Network (CDN).
Read more blog : How does a Content Delivery Network (CDN) improve performance?
4. Content Download
- Content Download: The time spent receiving the full response body.
- Optimization: High download times on small files point to poor network connections, while high times on large files indicate the need for image compression, minification, or payload splitting.
Advanced Network Diagnostics Workflows
Filtering and Searching Requests
Use the Filter box to isolate specific resources:
status-code:404orstatus-code:500finds failing endpoints.domain:example.comrestricts the view to first-party assets.larger-than:500kidentifies large files that impact Largest Contentful Paint (LCP).is:runningmonitors active long-polling or WebSocket connections.
Blocking Specific Request URLs or Domains
- Press
Ctrl + Shift + P(orCmd + Shift + Pon macOS) and run Show Network Request Blocking. - Click Add pattern and enter a domain or script pattern (e.g.,
*analytics.js*). - Reload the page to test how the site functions and renders without heavy third-party tags.
Read more blog : WordPress PHP Interview Questions for Web Developers

Exporting and Sharing HAR Files
HTTP Archive (HAR) files store complete network logs for offline sharing and remote debugging.
- Click the Export HAR icon (downward arrow) in the toolbar to save the current session.
- To analyze an external capture, drag and drop the
.harfile directly into the Network panel.
Frequently Asked Questions
What is the difference between Transferred Size and Resource Size?
Transferred size represents the actual bytes sent over the network, including compression (Gzip/Brotli) and HTTP headers. Resource size is the uncompressed size of the file after the browser extracts it into memory. If both numbers are identical, text compression is not active on your server.
Why do some requests show up in red?
Requests highlighted in red indicate network failures, such as client errors (4xx), server errors (5xx), CORS policy violations, or connections blocked by client-side browser extensions.
How does HTTP/2 affect request queueing in DevTools?
HTTP/2 uses multiplexing over a single TCP connection, removing the browser limit of 6 concurrent connections per host. This drastically reduces Queued and Stalled times compared to HTTP/1.1.
