



ENode.js runs on Google’s open-source V8 JavaScript engine, abstracting low-level memory allocation and deallocation away from developers. While this abstraction speeds up development, high-throughput applications, long-running microservices, and event-driven backends can suffer from memory leaks, latency spikes, and Out of Memory (OOM) crashes if memory architecture is poorly understood.
1. The Anatomy of Node.js Memory (V8 Engine Internals)
When a Node.js process starts, the OS assigns it a dedicated memory segment. The total memory consumed is called the Resident Set Size (RSS).
Call Stack
Stores execution frames, function calls, primitive values (numbers, booleans, strings within scope), and pointers referencing objects on the heap. It operates on a strict Last-In, First-Out (LIFO) basis and is freed immediately upon function return.
V8 Heap Structure
The heap is reserved for reference types (Objects, Arrays, Closures, Functions). V8 subdivides the heap into distinct spaces:
- Young Generation (1–64 MB): The landing zone for newly allocated objects. It is further split into:
- Nursery: Where new allocations occur.
- Intermediate (To/From Survivor Spaces): Semi-spaces used to preserve surviving objects across collection cycles.
- Old Generation: Holds long-lived objects that survived multiple minor GC cycles:
- Old Pointer Space: Contains objects holding references/pointers to other objects.
- Old Data Space: Contains raw data payloads (strings, boxed numbers, raw byte arrays).
- Large Object Space: Objects exceeding the allocation limits of other spaces bypass the Young Generation and are allocated here directly. They are never moved by the garbage collector.
- Code Space (Code-space / Map-space): Houses the Just-In-Time (JIT) compiler’s generated machine code and Hidden Classes (
Maps) used for property access optimization.
Read more blog : What is Zero Trust architecture and why are companies adopting it?
Off-Heap Memory (Buffers & Native C++)
BufferAllocations: Fast, raw binary chunks allocated outside V8’s heap viaArrayBufferand Node’s internal C++ layers to bypass GC overhead during heavy I/O operations.- C++ Bindings & Native Addons: Native modules (e.g., database drivers, image processing tools like
sharp) allocate memory directly via system calls (malloc/mmap), completely independent of V8 limits.
2. Deep Dive: How Garbage Collection Works
V8 uses a Generational Garbage Collection hypothesis: most objects die young. To optimize CPU cycles, collection strategies differ between the Young and Old generations.
| Space | Garbage Collector | Frequency | Latency Impact | Strategy |
| Young Generation | Scavenger (Minor GC / Cheney’s Algorithm) | High (Every few ms) | Negligible (< 2–5ms) | Copying & Compacting |
| Old Generation | Major GC (Full Mark-Sweep-Compact) | Low (Periodic) | Moderate to High | Mark, Sweep, Compact |
Minor GC: Cheney’s Copying Algorithm (Scavenger)
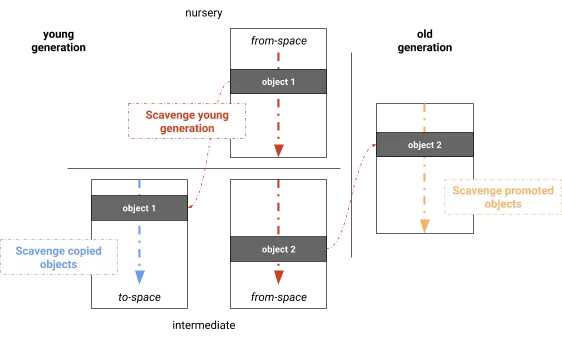
The Young Generation semi-space is split into From Space and To Space:
- New objects are allocated in the active From Space.
- When the space fills, a Minor GC triggers.
- V8 scans root pointers. Surviving reachable objects are copied contiguously into the To Space, automatically compacting memory. Dead references are discarded.
- If an object survives a second cycle, it is promoted (tenured) to the Old Generation Space.
- The roles of the two semi-spaces swap (From Space $\leftrightarrow$ To Space).
Major GC: Mark-Sweep-Compact (Orinoco Engine)
When the Old Generation approaches capacity, a Major GC cycle initiates:
[Marking Phase]      Root Reference Traversal --> Identify Reachable vs Unreachable Objects
                            ↓
[Sweeping Phase]     Scan Free-Lists --> Reclaim Unreachable Memory Blocks
                            ↓
[Compacting Phase]   Shift Surviving Objects Contiguously --> Defragment Free Memory Holes
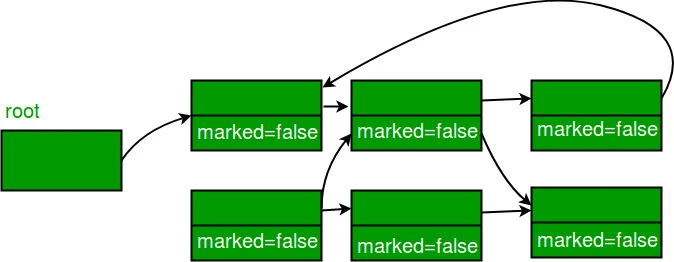
- Marking: Traverses the object graph starting from the global root (call stack pointers, global variables). Reachable objects are marked active; unreachable objects are left unmarked.
- Sweeping: Traverses memory free-lists to reclaim addresses left behind by unmarked objects.
- Compacting: Relocates surviving fragmented objects into contiguous memory blocks to eliminate fragmentation and speed up new allocations.
Minimizing Latency Spikes (Stop-The-World Mitigations)
Full garbage collection historically paused the main JavaScript execution thread (Stop-The-World). V8 mitigates this using modern concurrency paradigms:
- Incremental Marking: The engine splits the marking phase into tiny slices interspersed with JavaScript runtime execution, keeping latency frames under 16ms.
- Concurrent Marking & Sweeping: Dedicated background worker threads mark and sweep memory concurrently while JavaScript executes on the main thread.
- Lazy Sweeping: Sweeping is delayed and performed on-demand as new allocation space is required.
3. Detecting and Diagnosing Memory Leaks
A memory leak occurs when an application maintains unneeded references in the object graph, preventing the garbage collector from reclaiming that memory.
Common Memory Leak Patterns in Node.js
1. Unscoped/Accidental Global Variables
JavaScript
function handleRequest(data) {
  // Missing 'const/let/var' attaches 'leakStore' to the global object
  leakStore = data;
}
2. Dangling Event Listeners
JavaScript
const EventEmitter = require('events');
const eventBus = new EventEmitter();

function attachUserStream(userStream) {
  // Listener holds reference to 'userStream' forever if not deregistered
  eventBus.on('data_sync', (data) => {
    userStream.write(data);
  });
}
3. Closures Retaining Scope
JavaScript
let leakyReferenceHolder = null;

function produceLeak() {
  const largeArray = new Array(1000000).fill('*');
  const priorHolder = leakyReferenceHolder;

  // Unused closure shares lexical environment, locking 'largeArray' into heap
  return function unusedClosure() {
    if (priorHolder) return largeArray;
  };
}
setInterval(() => { leakyReferenceHolder = produceLeak(); }, 100);
4. Unbounded Caches and In-Memory Maps
JavaScript
const userCache = new Map();

function cacheUser(userId, userData) {
  // Unbounded: Continues growing until process hits Out Of Memory (OOM)
  userCache.set(userId, userData);
}
4. Diagnostics & Profiling Toolchain
1. Inspecting Memory via Runtime API
JavaScript
const mem = process.memoryUsage();
console.table({
  rss: `${(mem.rss / 1024 / 1024).toFixed(2)} MB`,
  heapTotal: `${(mem.heapTotal / 1024 / 1024).toFixed(2)} MB`,
  heapUsed: `${(mem.heapUsed / 1024 / 1024).toFixed(2)} MB`,
  external: `${(mem.external / 1024 / 1024).toFixed(2)} MB`,
  arrayBuffers: `${(mem.arrayBuffers / 1024 / 1024).toFixed(2)} MB`
});
2. Chrome DevTools & Heap Snapshots
- Run your application with the inspector flag:Bash
node --inspect app.js - Open
chrome://inspectin Google Chrome and click Inspect. - Under the Memory tab, take a baseline snapshot, generate traffic (e.g., using
autocannonork6), and capture a second snapshot. - Select Comparison View to isolate growing objects (look for high
Retained SizevsShallow Size).
5. Production Best Practices
Tune V8 Limits for Containerized Environments: When running in Docker/Kubernetes, tune heap size to match container limits:Bashnode --max-old-space-size=1536 server.js
Replace unbounded objects with TTL/LRU caches: Use lru-cache or external stores like Redis. Use WeakMap or WeakSet for metadata associations where keys can be garbage-collected once their primary references are lost.
JavaScript
const fs = require('fs');
const readline = require('readline');

const rl = readline.createInterface({
  input: fs.createReadStream('large_dataset.csv'),
  crlfDelay: Infinity
});

rl.on('line', (line) => {
  // Process line-by-line without buffering entire dataset in heap
});
You may also like:
1) How do you optimize a website’s performance?
2) Change Your Programming Habits Before 2025: My Journey with 10 CHALLENGES
3) Senior-Level JavaScript Promise Interview Question
4) What is Database Indexing, and Why is It Important?
5) Can AI Transform the Trading Landscape?
Read more blogs from Here
Share your experiences in the comments, and let’s discuss how to tackle them!
Follow me on Linkedin
Frequently Asked Questions
What is the default memory limit in Node.js, and how can I increase it?
On 64-bit systems, Node.js defaults to a max heap size of roughly 2 GB (or ~4 GB in newer V8 versions depending on available system memory). If your workload requires more memory, you can adjust this limit at startup using the --max-old-space-size flag (e.g., node --max-old-space-size=4096 app.js sets the limit to 4 GB).
What is the difference between Shallow Size and Retained Size in heap snapshots?
Shallow Size is the memory held directly by the object itself for its own primitive values and immediate structure. Retained Size is the total amount of memory freed once that object is garbage collected—including all other objects and references held alive solely through it.
Can manual calls to global.gc() improve production performance?
No. Running global.gc() (enabled with the --expose-gc flag) forces synchronous, full garbage collection cycles that block the main event loop, causing latency spikes and degraded throughput. V8’s internal heuristics are already optimized to schedule GC cycles efficiently.
